
Release 14 “Harpalyke” is out. Its main theme is paying only for what a workload uses at any given moment. Instances can now grow and shrink their memory and vCPUs while they run, and a GPU is assigned to an instance only while that instance runs, so an idle GPU workload no longer holds on to the most expensive part of a node. GPU and headful-browser workloads can now also scale to zero.
The second theme is getting inside your instances. The new sandbox plugin gives you command execution, an interactive shell and file transfer into a running microVM, from the CLI, the dashboard, the JavaScript SDK and kubectl exec.
And because Release 13 made images kernel-less, a Dockerfile is now all you need to build one. On top of that: live event streams with attribution, a managed network mode, and a dashboard where you can now create instances, manage tokens and take checkpoints.
Enterprise features ship with the Harpalyke platform packages. The CLI, dashboard and SDK updates are live for everyone.
Platform
The theme of R14 on the platform is paying only for what a workload uses right now. Instances resize while they run, GPUs follow the instances that are actually working, and the workloads that are idle most often can now scale to zero.
Vertical scaling of memory and vCPUs
EnterpriseSizing an instance has always meant guessing its peak. Size for the peak, and you pay for memory that sits idle most of the day. Size for the average, and the instance struggles when traffic arrives.
With R14 you no longer have to choose. Give an instance a range, and it grows and shrinks its memory and vCPUs while it runs: memory is added when the guest needs it and handed back when it does not, and the guest takes an extra vCPU when work is queuing and releases it when it goes quiet. No restart, no redeploy.
used 1071 / 2048 MB · 977 MB unused
Sized for the peak. Most of the reservation sits unused.
used 1071 / 1280 MB · 209 MB unused
Sized to the load. Memory is added and returned in 128 MB steps.
{
    "min_memory_mb": 256,
    "max_memory_mb": 2048,
    "min_vcpus": 1,
    "max_vcpus": 4,
    ...
}
This matters most for workloads with uneven load: APIs with daily peaks, agents that sit idle between bursts of work, databases that spike during batch jobs. Each instance uses what its load needs at the moment, so the same node fits more of them. It works alongside scale-to-zero, too: an instance that resumes keeps the size it had.
Vertical scaling is available today for microVMs on x86-64, and comes to the hosted platform in the next release.
GPU snapshots and NVIDIA vGPU
EnterpriseGPUs are the most expensive resource on a node, and until now an idle GPU instance held on to its GPU for as long as the instance existed, running or not.
R14 changes that. A GPU is assigned only while its instance runs. When the instance suspends or scales to zero, the GPU’s state is saved with the snapshot and the GPU is free for whoever needs it next. When the instance resumes, it picks up where it left off, on the same GPU if it is free or on another of the same model.
GPU busy 58%
B never got a GPU
Suspended instances sit on their GPUs. New work waits for hardware that is doing nothing.
GPU busy 90%
B started at once; A resumed on another GPU
Suspending saves the GPU state with the snapshot and frees the GPU for whoever needs it next.
For inference and agent workloads that are busy in bursts, the GPUs you pay for are now the ones doing work, and GPU workloads can scale to zero like everything else on the platform.
Operators can also now offer NVIDIA vGPUs, which split one physical GPU into several virtual ones. Smaller models and lighter workloads no longer need a whole card, so one GPU can serve several instances.
Scale-to-zero for GPU and browser workloads
EnterpriseHeadful browsers and GPU inference are exactly the workloads that sit idle between requests, and until now they were also the ones that could not scale to zero. Now they can: they suspend when idle, stop using node resources, and resume on the next request, with or without their state.
They also get the rest of the toolkit: templates to start from a prepared state, ROMs to ship large read-only data such as model weights separately from the image, plugins and startdata. If you run browser automation or inference for many users, you stop paying for the hours when nobody is using them.
Know why every instance changed
EnterpriseWhen an instance stops, the first question is usually why. Was it a user, the autoscaler, scale-to-zero, a quota, or did the app exit on its own? Until now, answering that meant digging through logs.
Instance events now carry the answer. Every state change says who or what caused it, from an API call and the user behind it to autoscaling, scale-to-zero, a scheduled operation or the guest itself. Failed starts get their own event with the error. And you can follow all of it as a live stream, filtered to the instances and tags you care about.
For security and compliance teams, this is an audit trail of who changed what, with no extra tooling. For operations, it means alerting on specific causes, such as instances stopping because a quota ran out or no GPU was free, and reacting to changes as they happen instead of polling the API.
Managed network mode
EnterpriseSome teams already run their own networking, with VPNs, overlay networks or routed data-center fabrics and their own addressing, routing and firewalls. For them, the platform’s built-in address pool and NAT only get in the way.
Managed network mode steps aside. The platform creates no network devices and assigns no addresses, and instances attach directly to the network interfaces you have set up, with addresses from your request or your CNI plugin. Your instances join your network, on your terms. The default mode is unchanged.
Routes from your CNI
EnterpriseR13 let your CNI plugin or IPAM system decide an instance’s addresses. R14 lets it decide the routes as well, applied at boot and again on resume. Instances that need to reach several networks get there without custom boot scripts.
Nested virtualization on ARM64
EnterpriseR13 brought both ARM64 hosts and nested virtualization, but not together. Now instances on ARM64 can run their own hypervisor and still be suspended and resumed, so software that ships its own VMs, such as Android emulators, can take advantage of ARM64 capacity.
Smaller improvements
- Read endpoints accept their parameters in the URL, so waiting for an instance or reading its log is a single URL for scripts, monitoring probes and browsers. Available to all customers.
- Pipelines can unpin an image with the same URL they pinned it with, instead of looking up its UUID first.
- Resumes from a snapshot are faster, thanks to a smaller default prefetch size.
- The instance status shows which instance a relay interface belongs to.
- The controller now runs on hosts without IPv6.
- The guest kernel is updated to Linux 6.12.110.
Tooling
The CLI and the dashboard now let you look inside a running instance, build from the Dockerfile you already have, and let short-lived resources clean up after themselves.
Sandboxes and plugins in the CLI
Until now, an instance was something you could start, stop and read logs from, but never look inside. Debugging meant baking tools into the image and deploying again.
R14 introduces plugins, which add capabilities to an instance, and the first official one: the sandbox plugin. Attach it, and you can run commands on the instance, open an interactive shell, and move files in and out, straight from the CLI.
unikraft instance shell my-instance
unikraft instance exec my-instance -- ls -la /var/log
unikraft instance copy ./config.json my-instance:/etc/app.json
The shell feels local: your working directory, variables and history stay with you, while every command runs on the instance. Use it to debug a live service, inspect state after an incident, or give an AI agent a safe place to run code. The shell is experimental, and full-screen programs like vim or top are not supported yet.
Dockerfile builds
Most applications already come with a Dockerfile, but getting them onto Unikraft also meant writing a Kraftfile. Since R13 made images kernel-less, that step is gone. Point unikraft build at a Dockerfile and you get an image:
unikraft build ./Dockerfile --arch x86_64 --output my-org/my-app:latestFor teams moving existing services over, the path from source to a running microVM is now the Dockerfile they already maintain. Projects with a Kraftfile build exactly as before.
Autokill from the CLI
CI jobs, preview environments, one-shot tasks and checkpoints taken “just in case” tend to outlive their purpose and pile up until someone cleans them up by hand. You can now give instances, service groups, templates and checkpoints a lifetime from the CLI, such as five minutes after stopping or after a hundred requests, and they delete themselves when it is up. Nothing is deleted unless you ask for it.
The dashboard
The dashboard used to be where you watched what you had built elsewhere. With R14, you can create an instance, open a shell into it and checkpoint it without leaving the browser.
Sandbox shell
Open a shell into any instance running the sandbox plugin, right from its page. What's cool about this: when you hit the button a sandbox plugin is dynamically added to a running microVM to provide this functionality. In millis of course.
New instance page
Create an instance from an official image or your own registry, pick a metro and set its resources, without touching the CLI. The form lives in the URL, so a half-finished configuration can be bookmarked or sent to a colleague.
Named API tokens
Give every laptop, pipeline and teammate their own token. When one leaks, revoke it without cutting off everyone else.
Service pages
See how much traffic a service handles, which instances sit behind it and how busy each one is, so you can tell at a glance whether it is under pressure.
Checkpoints
Freeze an instance's state with one click and browse its history. Rolling back from the dashboard comes in the next release.
Quotas
See how much of every resource your organization can use, in one place. This was not visible anywhere before.
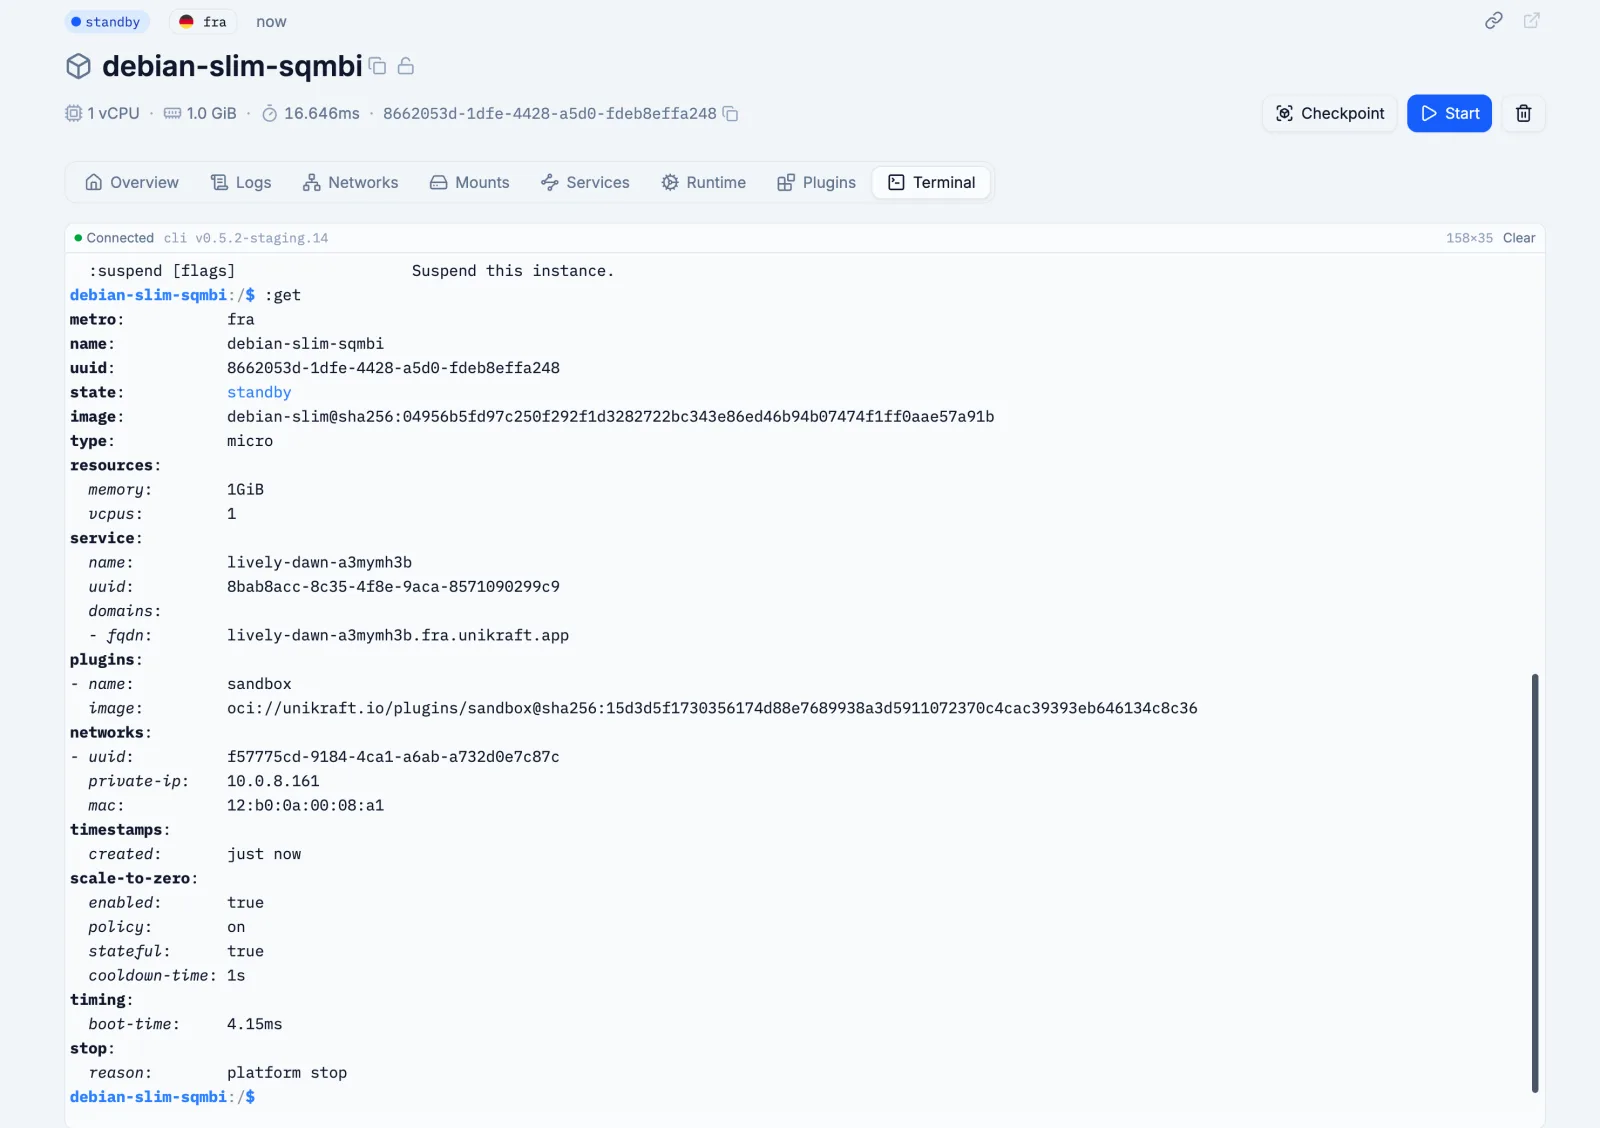
A terminal attached to a running instance, straight from its page in the dashboard.
Integrations
Sandboxes also reach the tools you already use: the JavaScript SDK and kubectl.
Sandboxes in the JavaScript SDK
If you are building an AI agent, a coding assistant or anything else that runs code on behalf of your users, each task needs an isolated place to run. The @unikraft/cloud SDK now creates one in a few lines: a sandbox cold-starts, runs your task and cleans up in milliseconds.
import { Sandbox } from "@unikraft/cloud";

// `await using` cleans up the sandbox once the script is done
await using sandbox = await Sandbox.create();

const { stdout } = await sandbox.exec("echo hello");
console.log(stdout); // hello
Each sandbox is a full Unikraft microVM, so it is strongly isolated from everything else you run. Attach a volume to keep work between sessions, and let scale-to-zero pause the sandbox while the user is away, so idle sessions cost nothing.
Read more about sandboxes in the JavaScript SDK →
kubectl exec for Kraftlet
Enterprise
Teams running Unikraft-backed pods through Kraftlet can now use kubectl exec, just as with any other runtime. The debugging habits and tooling your team already has keep working, and exec is enabled per pod, so you decide which workloads allow it.
A sneak preview of what’s next
A taste of what Release 15 has in store:
Windows VMs support
We've been a Linux outfit until now, that's about to change 🙂.
Live Migration
Capacity on a server got you down? Time to move workloads/microVMs around!
Dashboard: Interactive CLI
Our CLI directly embedded into our dashboard -- no need to switch between the two anymore if you wanted.
Hotplug
For plugins and ROMs -- add them and remove them while the microVM is actually running.
…and several others we are not listing, because we do not want to spoil all of the fun :)